

I’m always looking for more effective ways to visually communicate in my Powerpoint presentations so that I can share the findings with you!
I always seek to learn from the best – In this case, it’s Edward Tufte:
You will learn a lot from him.
Edward Tufte is a distinguished Yale University professor emeritus who has made a lifetime of studying, writing and teaching about the visual display of information.
With the Edward Tufte Course coming to the Bay Area, I thought this would be a good opportunity to talk a little about his influence in the field of visual information.
Tufte has written some excellent books on this topic such as the Visual Display of Quantitative Information, which sounds like a lofty academic book but is a useful and very engaging read that I highly recommend.
The Edward Tufte Way
Tufte writes, “Graphical excellence is that which gives to the viewer the greatest number of ideas in the shortest amount of time with the least ink in the smallest space.” These are words to live by for the slide designer.
I thought I would share five lessons I’ve learned from Tufte over the years that could easily contribute to more effective presentations.
While he emphasizes simplicity and clarity in his graphics, he focuses on the importance of balance and complete, accurate presentation of information. This allows the audience to form opinions and make informed decisions about what they see.
1- Bullets Can Kill Your Presentations
Microsoft built PowerPoint around the idea of bullet points, short truncated phrases on the slide designed to remind the speaker and the audience of more complex points.
Bullet points are useful when used the right way, yet, very dangerous when not.
The danger is to you and your argument:
If you create your presentation narrative first and slides next; then you should be in good shape. However…. Most people don’t!
Instead, they create slides and add bullet points to them. Then try to come up with a fitting narrative to match the slides.
If that’s you, then will receive NO judgment from me because I used to go through the same process when it came to giving presentations in my corporate life.
The purpose of your presentation is to convey an idea, a logical argument, and a direction. That should be your primary focus. However, the moment you throw the bullet points on the slides your purpose changes.
Your new purpose becomes to make the bullet points sound good together. So you shape your story and narrative to fit the bullet points, forgetting about your original intent.
That’s how you kill your presentation with bullets.
Now you know better.
So I challenge you to create your narrative and arguments, build your case without the slides, and then when ready create the slides and the bullet points that support your original goal.
The danger of bullet points to your audience:
In corporations, a lot of your presentations end up on a shared drive. These presentations often end up being used as a report by others in your organization as a foundation for their decisions. If the bullet points don’t follow a cohesive narrative, they can lead to inefficiency, mistakes, and sometimes disasters.
Tufte argues that this truncation of information was a major contributor to the Columbia shuttle disaster of 2003. He writes that engineers were compelled to shorten information to fit the bullet point format and by doing so their slides failed to disclose the risks of the shuttle launch.

“There are many true statements about complex topics that are too long to fit on a PowerPoint slide.” Edward Tufte
The lesson here is that it’s good to get away from the habit of trying to reduce everything to bullet points and to explore other ways to display information. In some cases, this will mean slides with a higher density of information if message comprehension requires it.
Simplicity is one of Tufte’s key messages, but he always emphasizes that the best way to show information is in a way that communicates clearly and completely in the least amount of space.
Sometimes, detail is required, and we shouldn’t oversimplify a slide just to make it look better. That’s why I am not always against dense slides like most presentations experts are. I come from a technical background, and I know that sometimes you have to put a lot of information on a slide. This, however, does not give you permission to be lazy and just create a “data dump” slide.
You have to think about your audience while they are listening to you and your audience using your presentation later as a reference and optimize the information on the slides based on those two things.
2- Don’t Settle For Generic Data Visualization
There are many familiar formats for displaying information on slides. For example, we often use a list of bullet points, as mentioned above, or a bar or pie chart, diagram or photographic image.
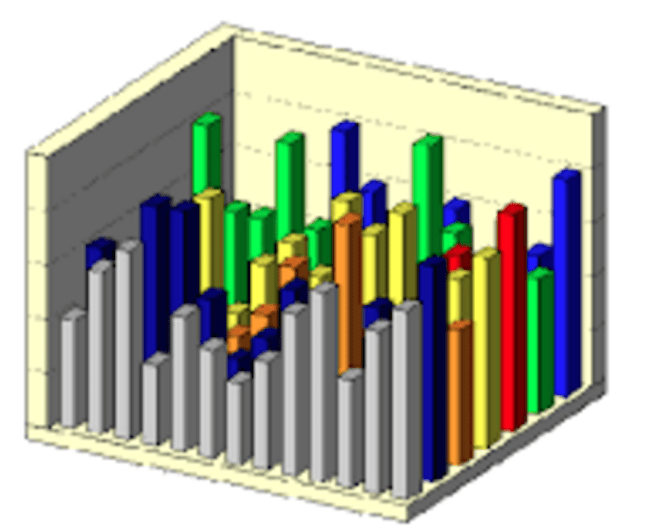
That is very limiting. You are smart, you are creative, and you care about communicating effectively. So think outside the box to express your ideas and data better. Don’t just take what Excel gives you because sometimes that’s not the best way to display your thoughts.
There are many alternatives available to you. A complex Excel 3D bar chart, for example, might not be the best way to display data. You can use concentric circles with size proportional to the magnitude of the data points to better make your point.
For example, see the chart below produced by NPR to convey Military Casualties and Deaths by conflict: notice the difference between the Persian Gulf War and World War II.
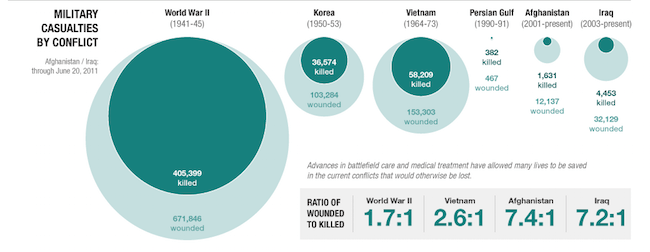
Sure, they could have used an Excel bar chart for this. But it would not have been as elegant or as memorable. This chart has received recognition from MSNBC, Huffington Post, Business Insider and at least 56 other reputable blogs because it is insightful and different.
So, how can you build better graphics? In addition to PowerPoint and Keynote for the Macintosh, there are many alternative presentation technologies available, such as crazy Prezi, which takes a unique multi-dimensional approach to data display.
Also, check out these 10 Tools for Creating Infographics and Visualization
3- You Can Learn From the Past
Tufte points out that the compelling display of visual information is nothing new. Throughout history, we can see examples of alternatives to traditional communications techniques, and we can learn from them and apply them.
Long before we had slides in PowerPoint presentations, professionals in various trades have been challenged to create effective displays of information.
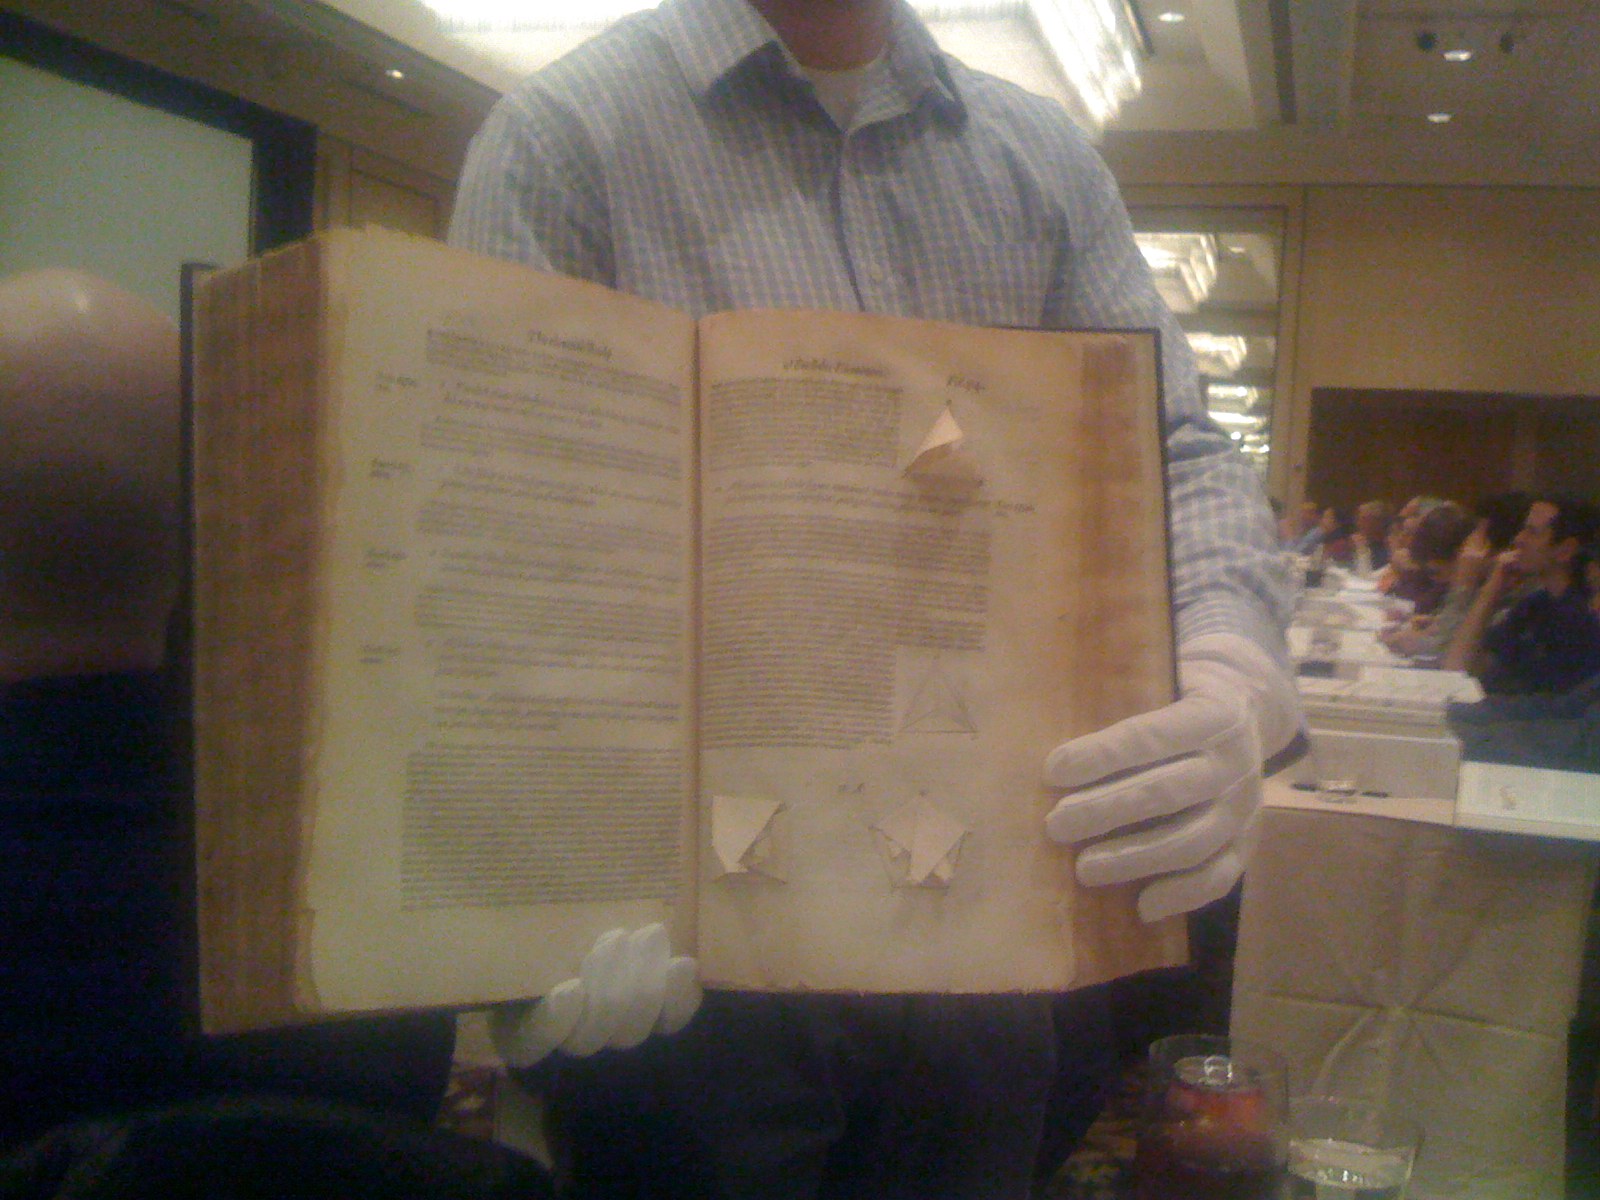
In his talk, Tufte often shows a 16th Century copy of Euclid’s Geometry which features a pop-up diagram of a pyramid (yes a pop up in an ancient book). Though published nearly 500 years ago, the publishers felt that the concept of the pyramid required more than a flat page to describe it.
Tufte also uses a fantastic example of an 1869 map drawn by a cartographer in Napoleon’s army portraying the losses suffered in the Russian campaign of 1812.
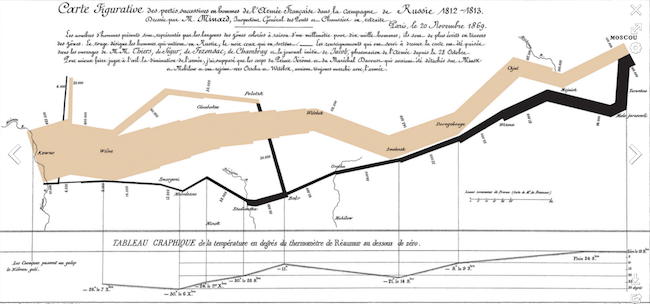
This deceivingly simple map illustrates an elaborate campaign over many months and shows six variables on a two-dimensional surface yet does so without clutter and extraneous information.
At a single glance, you can see the entire, heartbreaking story.
It’s unlikely that you’ll be required to document a military campaign, but a similar approach could be used to create a timeline for a marketing campaign or progress on a project.
For some practical PPT examples, I recommend spending time on SlideShare and looking through some of the presentations highlighted there.
If you want to learn to build better slides, then you need to look and learn from others. Learn from others in different fields, from different times, and from different viewpoints than you. Nothing is ever created in a vacuum.
4- Fancy Slides Won’t Fool Anyone
Another point Tufte is clear on is the difference between compelling information display and over-designed graphical information. No amount of eye-catching graphics, images, animation and bold typography will make up for lack of information or focus.
Audiences are informed consumers of information and will not be fooled by slides that do not clearly make their point.
As always, I recommend stepping back from your slide, viewing it in its entirety, and asking yourself the questions:
- Is the point of this slide clear
- Is everything I need to know about the subject of the slide clearly articulated on the slide, or is something missing?
- Are there unnecessary elements on the slide that create confusion or distract from the message?
- Do the graphics add to clarity, or are they unnecessary or too showy?
The most powerful slides are those that are reduced to exactly the right amount of information, clearly displayed.
5- Only Relevant Data, Clearly Shown, Will Help People Make Decisions on that Data
A mentor of mine told me to never show information to impress but to show information to influence.
A lot of presenters like to display all the information they have because they want to show the audience how much they worked, but that could get in the way of being influential. Please don’t fall into this trap; there is always an appropriate time and place for every number you got, but not all at the same time.
Making decisions based on evidence requires the appropriate display of that evidence.
“Good displays of data help to reveal knowledge relevant to understanding a mechanism, a process, and dynamics, a cause, and effect.” – Edward Tufte
In his book and lectures, Tufte offers some principles for the ideal representation of visual information. Here are a few of them, paraphrased:
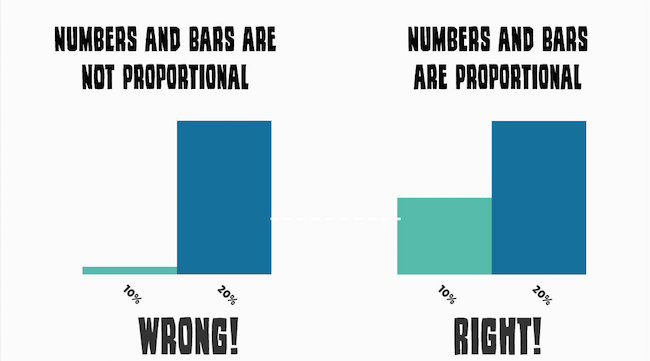
- Physical representations of numbers and numerical quantities should be proportional.
- Thorough use of labels and on-screen notes will help eliminate ambiguity and misunderstanding
- Think first of the information and data that you wish to present, design follows
- Information should be displayed in context so as to give complete understanding
Conclusion
These were just a few of the great insights Edward Tufte has to offer to help you produce more effective and more innovative slides for our presentations.
If you’re not familiar with Tufte, I hope you will check out his website, look into his books, and possibly attend one of his talks in San Francisco. Audiences are becoming increasingly sophisticated and demanding in their consumption of visual media, and as presentation designers, we must take the lead in new, innovative techniques for engaging and keeping their attention.

